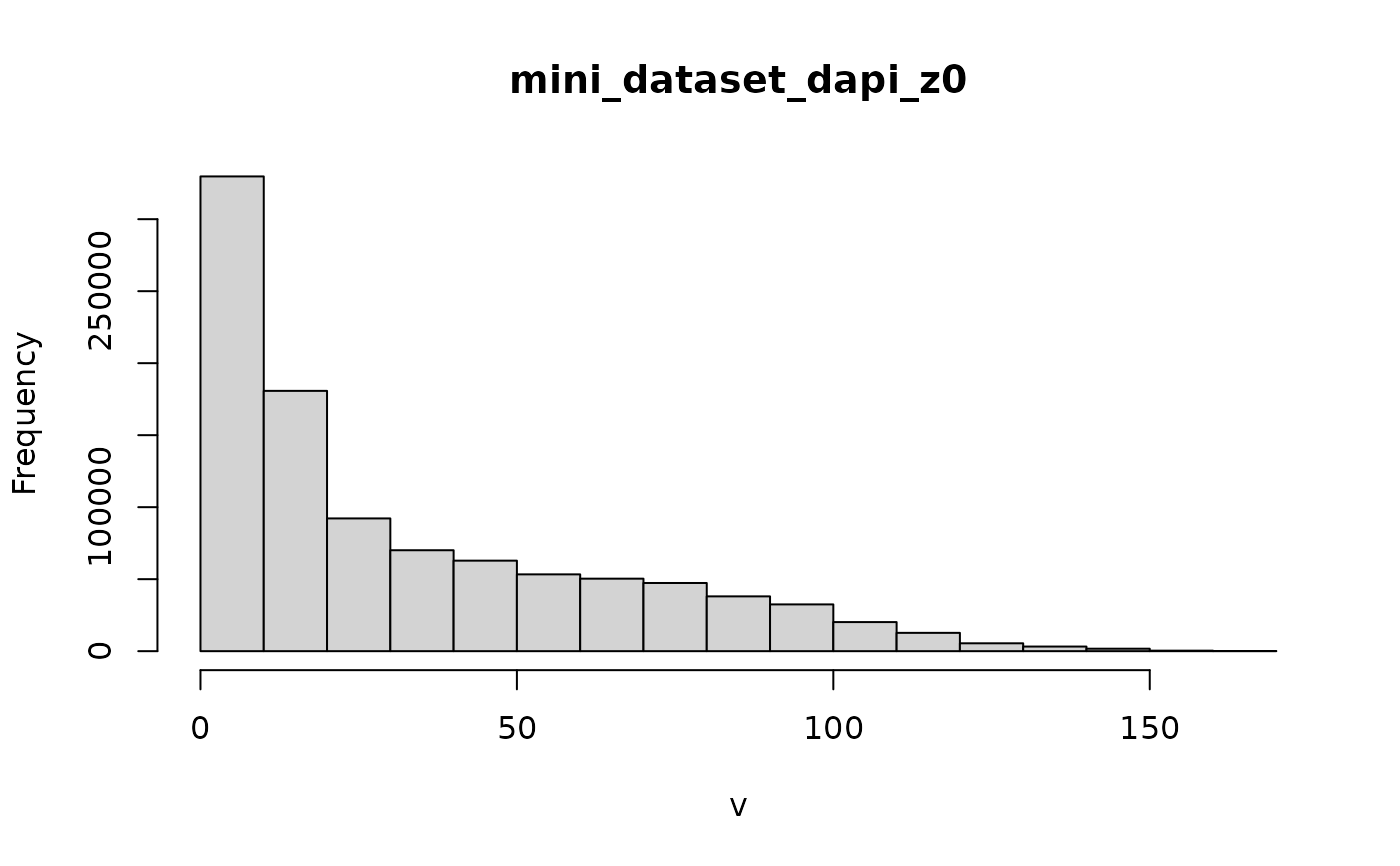
Create a histogram of the pixel values of a giottoLargeImage. Wrapper around
terra::hist()
Arguments
- x
giottoLargeImage
- show_max
logical. Plot the set max intensity as a vertical red line
- ...
Arguments passed on to
terra::histlayerpositive integer or character to indicate layer numbers (or names). If missing, all layers up to
maxnlare usedmaxcellinteger. To regularly sample very large objects
plotlogical. Plot the histogram or only return the histogram values
maxnlpositive integer. The maximum number of layers to use. Ignored if
layeris not missingmaincharacter. Main title(s) for the plot. Default is the value of
names
Examples
f <- system.file(package = "GiottoClass", "extdata/toy_intensity.tif")
gimg <- createGiottoLargeImage(f, use_rast_ext = TRUE, verbose = FALSE)

hist(gimg)
#> Warning: [hist] a sample of 83% of the cells was used