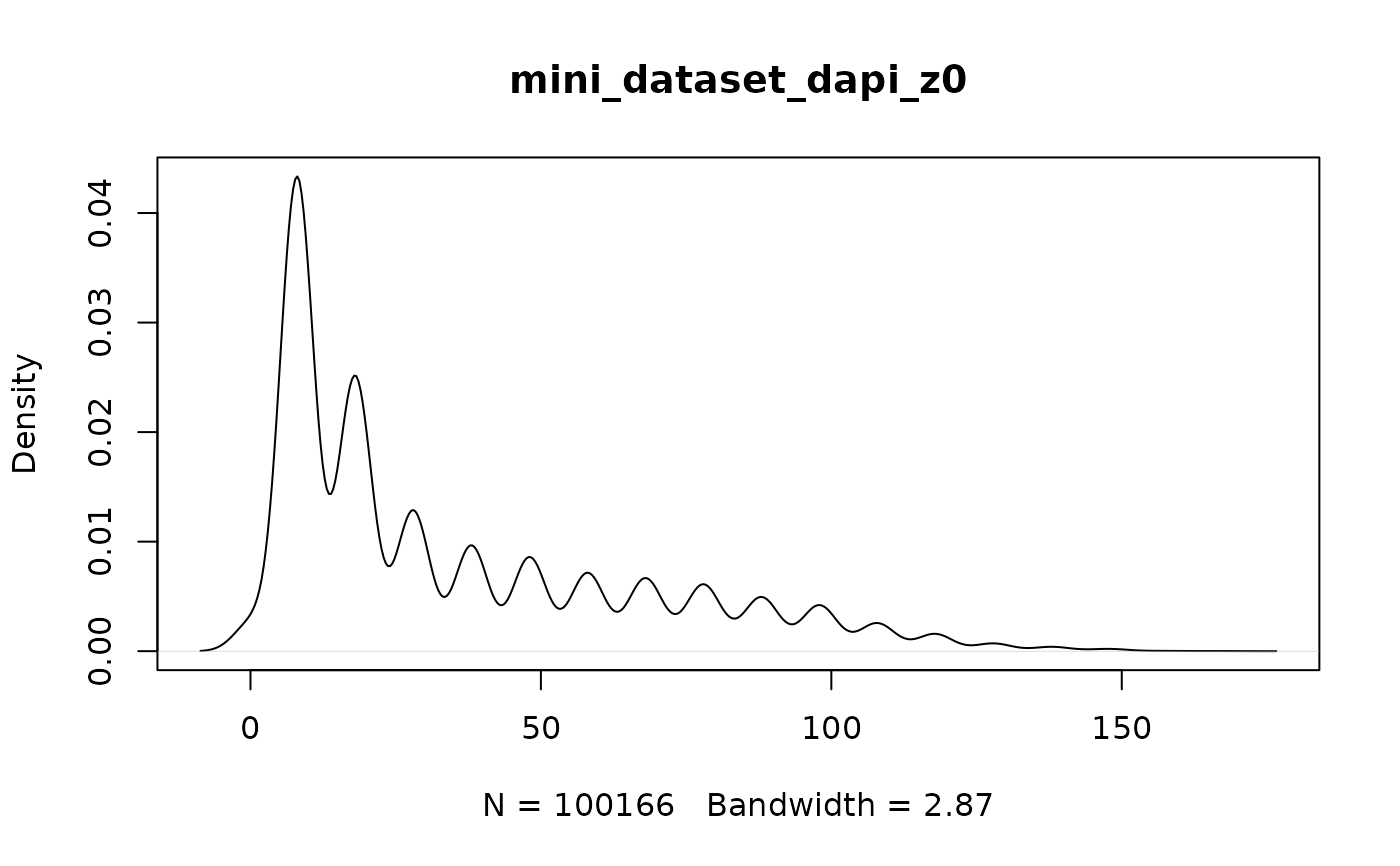
Create density plots of the pixel values of a giottoLargeImage. Wrapper
around terra::density().
Arguments
- x
giottoLargeImage
- show_max
logical. Plot the set max intensity as a vertical red line
- ...
Arguments passed on to
terra::densitymaxcellsthe maximum number of (randomly sampled) cells to be used for creating the plot
plotif
TRUEproduce a plot, else return a density objectmaincharacter. Caption of plot(s)
Examples
f <- system.file(package = "GiottoClass", "extdata/toy_intensity.tif")
gimg <- createGiottoLargeImage(f, use_rast_ext = TRUE)
#> use_rast_ext == TRUE
#>  extent from input raster_object will be used.

density(gimg)